Python-绘制图表

通过 matplotlib 绘制图表。

曲线图

1
2
3
4
5
6
7
8
9
10
11
12
13
14
15
16
import matplotlib.pyplot as plt

def curveChart(positionXs, positionYs, title, titleX, titleY, maxX = None, maxY = None):
plt.plot(positionXs, positionYs)
plt.title(title)
plt.xlabel(titleX)
plt.ylabel(titleY)
if maxX != None:
plt.xlim(0, maxX)
if maxY != None:
plt.ylim(0, maxY)

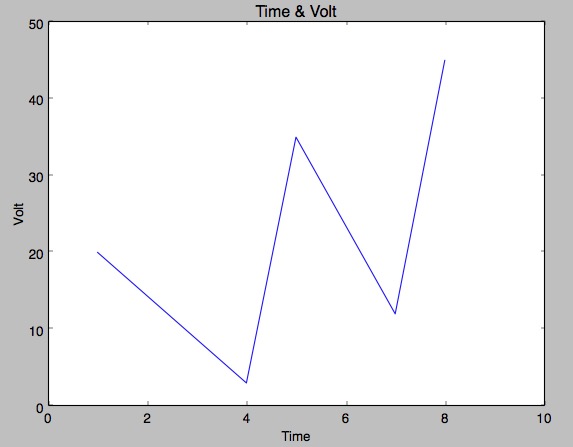
x = (1, 4, 5, 7, 8)
y = (20, 3, 35, 12, 45)
curveChart(x, y, 'Time & Volt', 'Time', 'Volt', 10, 50)
showChart()

python-curvechart

饼状图

1
2
3
4
5
6
7
8
9
10
11
12
13
14
15
import matplotlib.pyplot as plt

def pieChart(pltData, pltLabel):
plt.axes(aspect=1)
plt.pie(x=pltData, labels=pltLabel, autopct='%3.1f %%',
shadow=True, labeldistance=1.1, pctdistance=0.6)

def showChart():
plt.show()

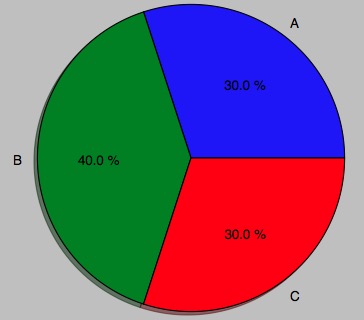
plotData = [30, 40, 30]
plotLabel = ['A', 'B', 'C']

pieChart(plotData, plotLabel)
showChart()

python-piechart

柱状图

1
2
3
4
5
6
7
8
9
10
11
12
13
14
15
16
17
18
19
20
21
22
23
24
25
26
27
28
29
30
31
32
33
34
35
36
37
38
39
40
import matplotlib.pyplot as plt

def showChart():
plt.show()

class barChartData :
barWidth = 2
def __init__(self, positionXs, positionYs, groupLabel, color):
self.positionXs = positionXs
self.positionYs = positionYs
self.groupLabel = groupLabel
self.color = color


def barChartGroup(barChartData):
plt.bar(barChartData.positionXs, barChartData.positionYs, barChartData.barWidth, label=barChartData.groupLabel, color = barChartData.color, alpha=0.4)

def barChartCommon(title, titleX, titleY, labelXs, positionLabelXs,pltPath = None, maxX = None, maxY = None):
plt.xticks(positionLabelXs, labelXs)
plt.xlabel(titleX)
plt.ylabel(titleY)
plt.title(title)
if maxX != None:
plt.xlim(0, maxX)
if maxY != None:
plt.ylim(0, maxY)
plt.legend()
if pltPath:
plt.savefig(pltPath)

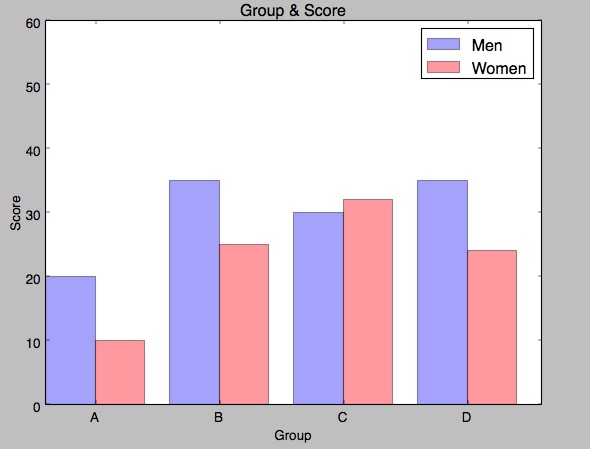
barChartData1 = barChartData((0, 5, 10, 15), (20, 35, 30, 35), 'Men', 'b')
barChartData2 = barChartData((2, 7, 12, 17), (10, 25, 32, 24), 'Women', 'r')
labelXs = ('A', 'B', 'C', 'D')
positionLabelXs = (2, 7, 12, 17)


barChartGroup(barChartData1)
barChartGroup(barChartData2)
barChartCommon('Group & Score', 'Group', 'Score', labelXs, positionLabelXs, None, 20, 60)
showChart()

python-barchart

散列图

1
2
3
4
5
6
7
8
9
import matplotlib.pyplot as plt

def scatterChart(positionXs, positionYs):
plt.scatter(positionXs, positionYs)

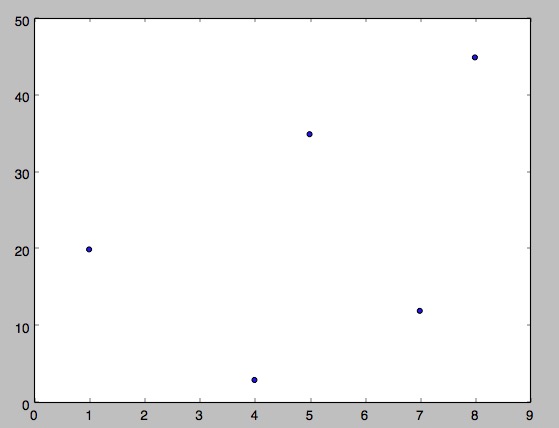
x = (1, 4, 5, 7, 8)
y = (20, 3, 35, 12, 45)
scatterChart(x, y)
showChart()

python-scatterchart

保存图

1
2
3
4
5
import matplotlib.pyplot as plt

def saveChart(pltPath):
if pltPath :
plt.savefig(pltPath)